
Excel Charts - Interactive Features
Add interactive features for Excel charts, such as check boxes or cell entries, to show and hide data.
Show Chart Series With Check Boxes
Add check boxes on a worksheet, to control which series will be shown in a chart. There is no programming required for this technique, and it works best for small to mid-sized tables.

Create a Duplicate Data Range
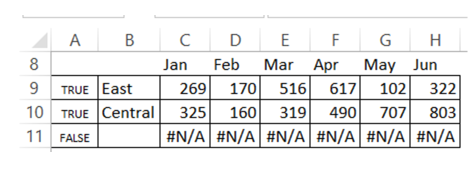
Instead of using the original data range to create the chart, you'll create a duplicate range, linked to the original data. In the duplicate range, formulas will show the series' data, only if the check box is checked. Otherwise, it will show #N/A, and the series will be omitted from the chart, because #N/A values are not plotted in an Excel chart.
In this example, the original data is in cells B2:H5, and the duplicate range, shown below, is in cells B8:H11

Add the Check Boxes
Next, you'll add a check box to the left of each region name in the orginal data. When the box is checked, its data will appear in the chart.


Link the Check Boxes to Worksheet Cells


Create a Line Chart


Format the Line Chart


Show Chart Series With X Marks
Instead of using check boxes, you can mark a series with an "X", to make it appear in a chart. Clear the "X", to remove the series from the chart.


Microsoft Accredited IT Training Provider
Microsoft Certified Training Materials
IT Training Courses delivered by Microsoft Accredited Facilitators
Microsoft MOS Test Centre London
No comments:
Post a Comment